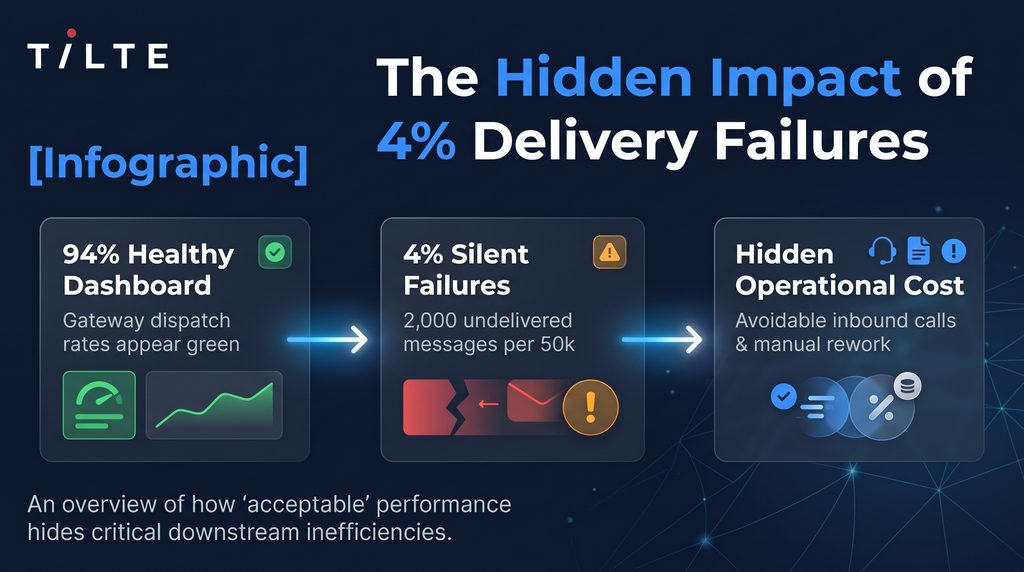
A 94% communication delivery rate looks like a good result. Leadership sees a healthy operation, the dashboard is green, and there’s little reason to question whether anything needs attention.
But communication delivery failures can remain hidden behind an otherwise healthy performance average, creating unnecessary customer enquiries, operational inefficiencies and potentially significant costs.
Both figures can be accurate. They simply tell very different stories.
The problem begins when organisations mistake an acceptable overall result for evidence that nothing needs attention.
When healthy averages hide communication delivery failures
Traditional business intelligence is good at explaining what happened. Dashboards show delivery rates, volumes, failures and engagement trends, giving leadership a convenient view of operational performance.
But averages can conceal where communication delivery failures are concentrated, which customers are repeatedly affected and whether those failures create additional work elsewhere in the business.
A failed communication doesn’t always end with a failed message.
A customer who doesn’t receive an important notification may contact a call centre, request another copy or require manual assistance. The communications platform records a delivery failure, while another department absorbs the operational cost.
Both teams report accurately, but neither necessarily sees the connection.
As we’ve explored in our article on the hidden cost of batch thinking, operational inefficiencies often emerge when information is disconnected from the people and processes that need to act on it.
The financial consequences of a communication failure may not appear where the failure occurred.
Surface Delivery Metrics vs. Real Operational Impact
| Operational Area | What a “Healthy” 94% Dashboard Shows | Hidden Impact of Communication Delivery Failures |
|---|---|---|
| Contact Centre Volume | High overall message dispatch rate across email and SMS | Surges in inbound calls from customers chasing missing statements, OTPs, or policy updates |
| Customer Journeys | Green SLA indicators at the individual channel gateway level | Stalled onboarding, missed payment reminders, and broken multi-step workflows |
| Repeat Customer Friction | Averages spread evenly across millions of monthly messages | Clustered communication delivery failures repeatedly affecting the same high-value accounts |
| Compliance & Audit Risk | Logs confirming messages left the internal sending queue | Unverified regulatory notices, delayed legal disclosures, and costly manual resend cycles |
| Root-Cause Resolution | Siloed vendor reports requiring manual cross-referencing | End-to-end orchestration that detects communication delivery failures early and triggers automatic fallback channels |
For operational and finance leaders, closing this visibility gap means connecting delivery telemetry directly to downstream business outcomes rather than celebrating isolated gateway averages. When messaging platforms operate as disconnected dispatch pipes, teams remain blind to the customers stuck waiting for critical statements, policy updates, or payment reminders. High-performing enterprises shift from passive delivery reporting to active communication orchestration—monitoring journey completion across email, SMS, WhatsApp, and print in real time. By identifying communication delivery failures early and automatically triggering verified fallback channels, organisations eliminate avoidable call-centre volume, protect cash-flow cycles, and ensure every critical customer interaction reaches completion.
Instead of asking IT and operations teams to reconcile fragmented vendor logs after customers complain, unified orchestration gives leadership a single source of truth across every touchpoint. The result is lower cost-to-serve, faster exception handling, and measurable confidence that critical communications are not just sent, but genuinely received and acted upon.
What does a 4% delivery failure rate actually cost?
Over a full twelve-month cycle, those hidden operational costs quietly erode margin while leaving leadership convinced the communication engine is performing well.
Consider an organisation sending 50,000 customer communications every month.
A 4% failure rate means 2,000 messages aren’t delivered. If 35% of those communication delivery failures result in an avoidable customer service call, at an estimated R70 per call, the potential cost becomes significant.
50,000 messages × 4% failed × 35% avoidable calls × R70 per call
Avoidable calls / month
700
Potential monthly cost
R49,000
Potential annual cost
R588,000
Illustrative assumptions only. Actual costs depend on call attribution and handling costs.
These are illustrative figures, not measured savings. Actual costs depend on customer behaviour, enquiry attribution and handling costs.
And this example only considers inbound calls, excluding repeated delivery attempts, manual interventions and other service-related consequences.
The true cost of communication delivery failures often extends beyond the original message. Repeated delivery attempts, avoidable customer enquiries and manual interventions can generate additional expenses across different departments.
Without connecting these activities to the original delivery failure, organisations may continue absorbing costs without recognising their source.
From reporting to Operational Intelligence
The opportunity isn’t simply to build better dashboards. It’s to change what organisations do with the information they already have.
At Tilte, we’re developing this thinking around Operational Intelligence: connecting communication performance with business impact, operational priorities and accountable interventions.
Instead of asking only how many communications failed, organisations need to understand which communication delivery failures matter most, why they matter and who needs to act.
That means identifying recurring problems, prioritising them according to their impact, assigning responsibility and measuring whether corrective action actually improved the outcome.
For communication operations, this involves four connected capabilities:
- Identify recurring problems. Detect communications, customer groups and delivery channels where failures are concentrated or persist over time.
- Prioritise by business impact. Assess which problems create the greatest customer friction, operational workload or potential financial exposure.
- Assign responsibility. Give a person or team clear ownership of the problem, the required intervention and the expected outcome.
- Measure the result. Determine whether the intervention improved delivery performance, reduced recurring failures or lowered avoidable operational costs.
This final step is particularly important.
Reporting tells you how the operation performed. Operational Intelligence helps you decide where to intervene.
Better reporting isn’t the answer. Better decisions are.
Organisations already collect enormous volumes of operational data. The challenge is connecting that information across systems and departments so that hidden problems become visible, commercially relevant and actionable.
A healthy delivery rate doesn’t necessarily mean a healthy customer experience.
Understanding communication delivery failures, their business impact and the actions needed to resolve them is what turns operational reporting into meaningful business intelligence.
Because knowing something is wrong and doing something about it are two very different capabilities.
You know your communication delivery rate. Do you know what your delivery failures are costing you?